
January 5-6 Winter Storm Case Study
Elijah Paciorek, Nico Sartori, Bailey Schaaf, Kaylee Sweeney, James Zinnbauer

Courtesy of Ohio University
Introduction
On January 3rd, 2025, a low pressure developed leeside of the Rocky Mountains, progressing eastward and developing into a potent winter storm. By January 5th, the system arrived in the Midwest region, delivering heavy winter precipitation in narrow corridors sharply divided by small variations in vertical temperature. Snowfall accumulations reached 6–12 inches in southern Ohio, while significant ice accumulation from freezing rain and sleet impacted Kentucky, Tennessee, and West Virginia. Widespread power outages and hazardous travel conditions ensued across Southeast Ohio. Using data from the WPC, NWS, and IEM, this case study aims to analyze the atmospheric setup contributing to the lifecycle of the low-pressure system, along with the regional and local impacts resulting from its arrival.
Synoptic Overview
A deep and positively tilted trough on January 3rd triggered the development of a surface low pressure on January 4th through leeside cyclogenesis. The low pressure began on the border of the Oklahoma Panhandle, while much of the Great Plains region was located within strong Arctic high pressure, contributing to widespread cold temperatures within the region. However, the low continued to strengthen as ample moisture from the Gulf of Mexico fueled its development, and it progressed into an open-wave as it reached the Mississippi Valley. By January 5th, the storm was already in late-stage maturity, and a trough of warm air aloft (TROWAL) had wrapped around the low-pressure core, further intensifying the precipitation from the storm. However, as this storm reached occlusion, its weakening allowed it to be more susceptible to steering from the upper-level trough, forcing it into more of a direct-eastward track rather than continuing to travel further northeast.
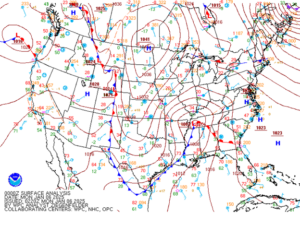
Fig. 1. Jan 06, 2025, 0000Z Surface Analysis. Low pressure is shown with a red L, with its cold fronts and warm fronts trailing from its core.
Event
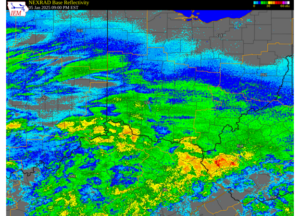
Fig. 2. Base Reflectivity across Indiana, Ohio, Kentucky, and West Virginia at 9:00 PM EST. Note the heavier precipitation occurring in the southern Ohio Region.
During the morning of January 5th, ample precipitation fell north of the warm front, beginning predominantly as snow throughout the lower Midwest but transitioning into more mixed precipitation as a 800 mb warm nose became more prominent during the daytime. The placement of the warm front was crucial to the accumulation of snow within the southern Ohio region – the warm front remained situated in the lower Tennessee valley, and therefore the extent of warm air advection did not push far northwards, keeping the warm nose relatively contained to the central Kentucky region. As such, due to a surge of low-level moisture, heavier snowfall began to fall in the southern Ohio region by the later evening, appearing in pseudo-convective bands. Snowflakes were also large and aggregated, given an optimization of Omega in the ~500 mb dendritic growth zone, and snowfall rates at time exceeded an inch per hour. This snow was centralized to the southern Ohio region – a band of dry air stationed across northern Ohio contained much of the snowfall to a corridor along the southern edge of the state. After the heaviest snowfall fell a few hours after midnight, a northward surge in the low pressure and subsequent warm front allowed for the encroachment of the 800 mb warm nose into the region, melting and refreezing some of the falling precipitation into sleet during the early morning hours of the 6th.
As the low continued eastward during the day on January 6th, it continued to occlude and produce additional snowfall in lighter bands throughout the day, delivering up to an extra inch in accumulation for the region. The winter storm completely exited the region by the end of the 6th, delivering ample amounts of snowfall to the southern Ohio region. Following the passage of the low pressure, higher pressure settled in alongside a deep cold as the upper-level trough remained stationed over the region.
Impacts and Hazards
Snowfall totals of 6 to 12 inches fell in a narrow corridor across much of southern Ohio, with Southeast Ohio accumulating between 8 and 12 inches. Athens County recorded snowfall amounts ranging from 7 to 9 inches, with some localized areas reporting up to 10 inches. This marks the highest snowfall total for the county since January 16-17, 2022, when a winter storm brought approximately 7 to 8 inches of snow following a transition from rain earlier in the day. While no ice accumulation was reported in Athens County, areas further south in West Virginia experienced widespread ice accretions of up to a quarter of an inch.
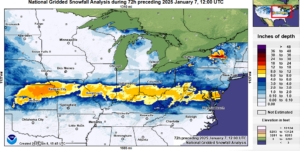
Fig 3. Total snowfall accumulation across the contiguous United States.
Nationally, the winter storm impacted over 189,000 homes and businesses across the central and southern United States, with thousands of power outages reported in West Virginia, Ohio, and Kentucky between January 5 and 6. In Athens County, the Sheriff’s Office declared a Level One Snow Emergency at 4:15 p.m. on January 5, which was upgraded to Level Two just an hour later. By 11:20 p.m., a Level Three Emergency was issued and remained in effect until 6:00 a.m. on January 7. The final Level One Emergency was lifted by January 13, as additional snowfall in the days following the storm continued to create potentially hazardous driving conditions.
Discussion and Conclusion
Several factors contributed to the widespread snowfall recorded in the southern Ohio region. First, as the cyclone weakened upon entering the Midwest, it became more susceptible to eastward steering by the upper-level shortwave. Should the cyclone have maintained its strength, it likely would have steered further north, pushing the warm front and the ensuing warm nose deeper into the region, delivering snowfall further north while generating a mixed precipitation event in the southern Ohio region. The timing of the cyclone itself was optimized for the maximization of moisture and track, as a weaker cyclone steered further south by the shortwave would have likely resulted in less precipitation in the southern Ohio region. Much of the US-50 corridor was uniquely placed in the region where snowfall would be the heaviest, as seen in Figure 3. Additionally, the encasement of the prominent low-level moisture by the band of northerly dry air allowed for locally intense banding to occur and likely played a significant role in the high amount of snowfall seen across southern Ohio. The placement of the warm front was excellent for minimizing warm-nose encroachment in the region, and furthermore, the inevitable warm air advection into the region occurred when the majority of snow had already fallen and low-level moisture had weakened, resulting in minimal sleet accumulation and maximized snow accumulation. The additional backend surge of moisture in localized snow banding once again promoted additional accumulations not associated with the warm-front event, and the slow-moving nature of the low core allowed for bands to persist for several hours. The combination of these ingredients made forecasting this winter storm difficult for many, especially given challenges in resolving cyclogenesis before the storm began.
The January 5-6 Winter Storm was a rare and impactful winter storm for southern Ohio, with its atmospheric setup nearly ideal for maximizing snowfall. The storm effectively paralyzed transportation across much of the region for over a day and caused widespread power outages. While Ohio is not frequently subjected to extreme snowfall events, this storm serves as a reminder that the right conditions can still align to produce significant, disruptive winter weather.
References
Akrherz@iastate.edu, D. H. (n.d.). IEM :: Radar & NWS Warnings. Iowa Environmental Mesonet. https://mesonet.agron.iastate.edu/GIS/apps/rview/warnings.phtml?osite=JKL&tzoff=0&layers%5B%5D=blank&site=JKL&tz=EST&archive=yes&year=2025&month=1&day=6&hour=19&minute=0&warngeo=sbw&zoom=250&imgsize=1024×768&loop=1&frames=157&interval=15&filter=1&cu=1&sortcol=fcster&sortdir=DESC&lsrlook=%2B&lsrwindow=0
Service, N. N. W. (2013, November 16). WPC Surface Analysis Archive. Weather Prediction Center (WPC) Home Page. https://www.wpc.ncep.noaa.gov/archives/web_pages/sfc/sfc_archive.php
US Department of Commerce, N. (2022, January 24). Complex winter storm produces widespread heavy snow January 16-17, 2022. National Weather Service. https://www.weather.gov/rlx/20220118-snow-review
US Department of Commerce, N. (2025a, January 8). Summary of the January 5-7 winter storm. National Weather Service. https://www.weather.gov/rlx/20250105-winter-storm
US Department of Commerce, N. (2025b, January 22). January_5_2025_winter_storm. National Weather Service. https://www.weather.gov/lmk/january_5_2025_winter_storm