For those curious about some vocabulary and parameters used in our forecasts, below is a rudimentary introduction to meteorology and our forecasting criteria, as well as resources to better inform yourself of hazardous weather. If you find yourself more curious about specifics, feel free to email our staff!
Scales
We commonly refer to trends completely spanning the Earth as part of the Global scale, and trends occurring nationally as belonging to the Synoptic Scale. The Mesoscale defines smaller regions of activity generally occurring within a U.S. state, such as thunderstorms, and the Microscale pertains to short lived, very local phenomena occurring in distances less than a thousand feet.
Jet Streams and Pressure
The Jet Stream is a global scale phenomena, and it is a belt of high winds traveling overall from west to east that wraps around the globe. This is located in what is called the upper-level atmosphere, which means that it is located higher up in the atmosphere at altitudes where airplanes usually fly. We will sometimes talk about mid-levels and lower-levels, which as the name implies, pertains to conditions in the middle levels of the atmosphere, and lower levels of the atmosphere, within a mile or so of the surface. The Jet Stream serves to steer most of the weather we experience in the United States. The Jet Stream will follow the boundaries of warm and cool air masses, so it is often not a straight west-to-east path, instead, dipping up and down across lines of latitude. These fluctuations in the jet stream can be labeled as troughs and ridges. In the U.S., troughs are associated with colder air further north moving south, and ridges are associated with warmer air further south moving north. Terms you will sometimes hear in our technical discussions are shortwaves and longwaves. These are used to describe the size of troughs. Jet streaks are small, intense bands of winds located within Jet Streams, which we will sometimes mention when covering a forecast for severe weather, as specific regions within jet streaks can promote strong storm development.
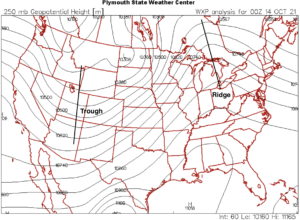
An example of an upper-level map with varied flow. A trough and a ridge are labeled. Credit to the Plymouth State University.
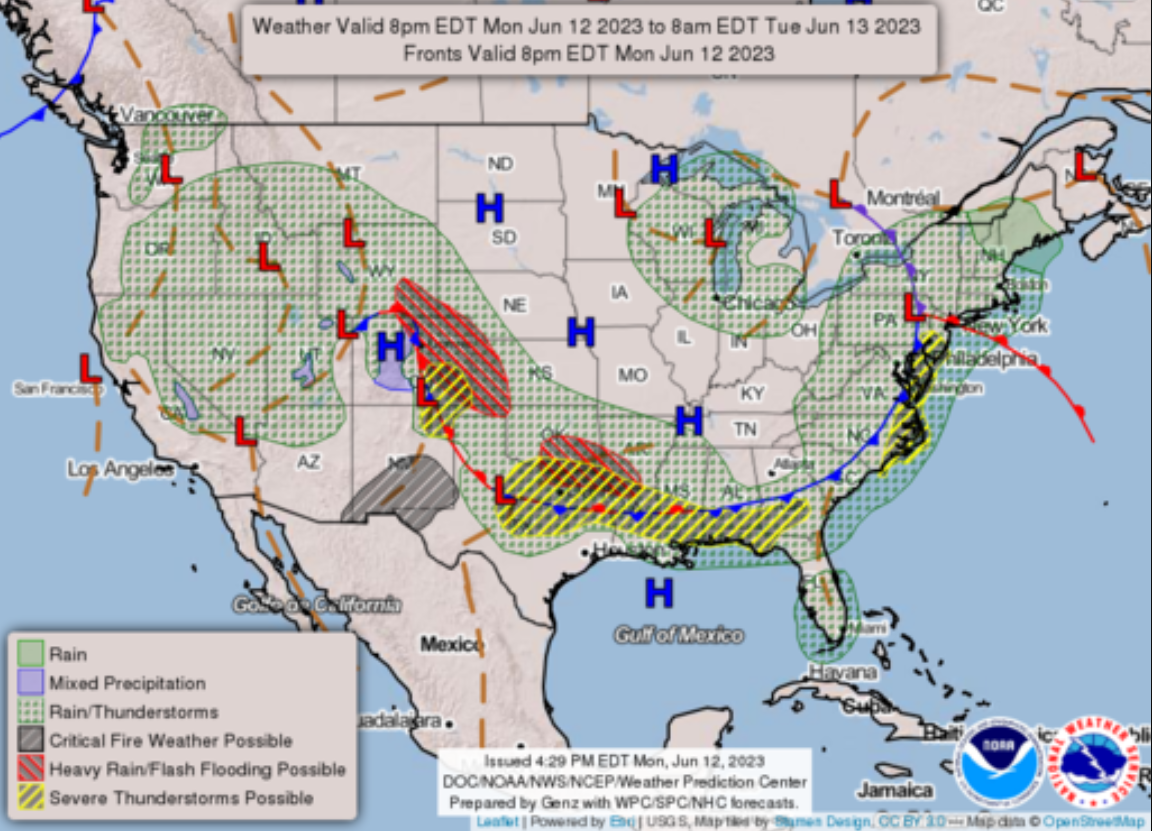
Pressure systems are likely one of the most common terms used within our forecasts, and are usually synoptic-scale phenomena. High pressures are regions of sinking air, which are usually associated with calm, clear weather (hence, ‘High and Dry’). Low pressures are regions of rising air, and are typically associated with precipitation and inclement weather. The mid-latitude cyclone is a common form of low pressure systems that affects us nationally. In typical mature mid-latitude cyclones, leading ahead of the system will be a warm front, which serves as the boundary between a cool, but often humid airmass, and moist, warm airmass. When a warm front passes, colder air will be pushed out, replaced by warmer and more humid air. Trailing below the mid-latitude cyclone is also a cold front, which is another boundary between the warm, moist air, and colder (but often drier) air. When a cold front passes, the warmer air is pushed out by colder air, and typically, thunderstorms will follow this line.
An example of a mature mid-latitude cyclone on the Eastern Seaboard. Credit to the Weather Prediction Center.
Thunderstorms
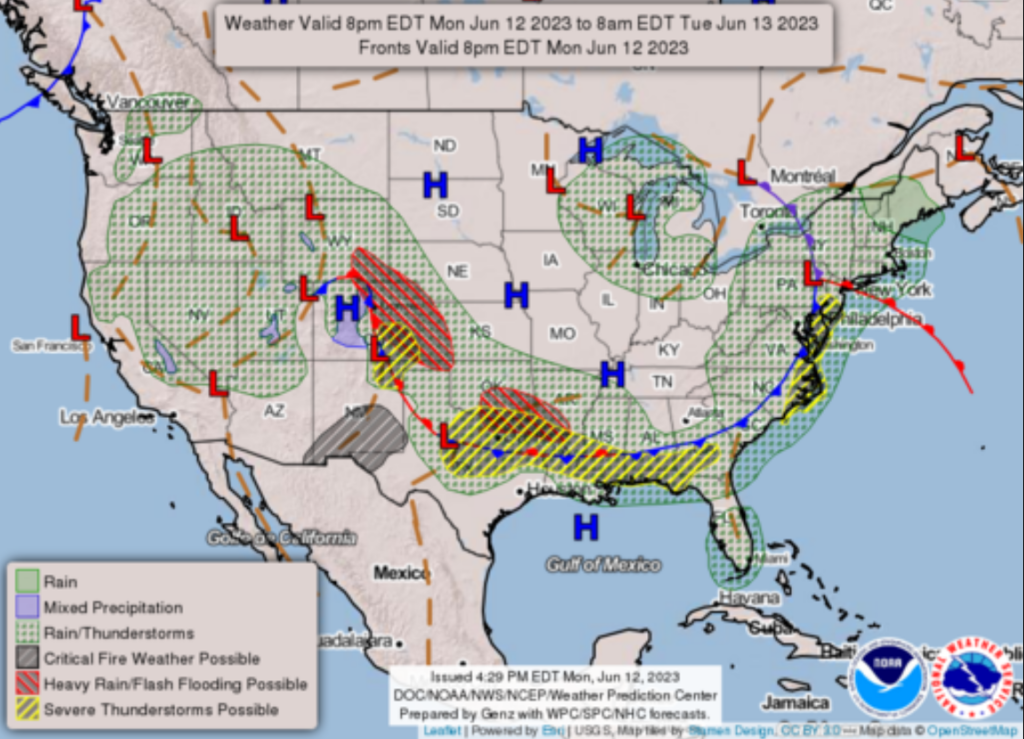
While thunderstorms are typically classified as mesoscale phenomena, their development is often influenced by synoptic-scale conditions, such as large-scale troughs, frontal systems, or upper-level disturbances. At the core of thunderstorm formation is the fundamental process of rising air. Warm air has a greater capacity to hold moisture in the form of invisible water vapor. When this warm, moist air is lifted, the air expands and cools. Cooler air cannot retain as much moisture, so the excess water vapor begins to condense into liquid droplets, forming clouds. If this process continues and droplets (or ice crystals) grow large enough, gravity will pull them toward the surface as precipitation. For any thunderstorm to develop, three fundamental atmospheric ingredients must be present: moisture, instability, and lift. Moisture, particularly near the surface, contributes to the formation of lower cloud bases and fuels the development of storm clouds. Instability refers to the atmosphere’s propensity to support rising air parcels; when a parcel is displaced upward and remains warmer than its surroundings, it will continue to rise, leading to deep vertical cloud growth characteristic of convective storms. Lift is the mechanism that initiates this vertical motion, pushing air parcels to levels where instability can take over. Common lifting mechanisms include orographic features (such as mountains), surface low-pressure systems, and most frequently in severe storm environments, frontal boundaries, where contrasting air masses converge. A fourth critical ingredient for the development of severe storms is wind shear, which enhances storm organization and longevity. Wind shear refers to changes in wind with height and is divided into two types: directional shear, where wind direction shifts with altitude, and speed shear, where wind speed increases with height. Adequate shear supports the tilting and rotation of storm updrafts, which can lead to the formation of supercells, long-lived multicell storms, and tornado-producing systems.
More unstable environments lead to stronger storms. Credit to Colorado University.
Severe Thunderstorms
The National Weather Service classifies a severe thunderstorm as one that produces wind gusts of at least 58 mph, hail with a diameter of one inch or greater, and/or a tornado. Heavy rain or frequent lightning do not meet severe storm criteria!
Thunderstorm Structure and Types
A genesis of convective storms is the updraft—a vertical column of rising air that forms as warm, buoyant, and unstable air ascends rapidly through the atmosphere. The inflow refers to the warm, moist air drawn into the base of the storm, which fuels the updraft. Strong and sustained inflow often signals a robust and organized updraft, which is critical for the development of severe weather phenomena such as large hail, damaging winds, or tornadoes. While the updraft serves as the storm’s energy supply, the downdraft represents its cooling counterpart. A downdraft is a column of cooler, denser air that sinks rapidly from the storm cloud toward the surface, typically driven by evaporative cooling and drag associated with precipitation. When this descending air reaches the ground, it spreads horizontally as outflow. The leading edge of this outflow is known as the outflow boundary or gust front. This boundary can act as a new lifting mechanism, triggering additional convection as it moves into unstable air. In some cases, it may lead to the development of new thunderstorms, especially in environments where the atmosphere remains moist and unstable behind the initial storm system.
Single-cell thunderstorms:
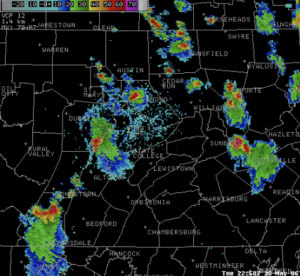
Single-cells, or “ordinary” storms, typically develop on hot, humid days within relatively uniform airmasses. These environments are characterized by weak wind shear—both in speed and direction—which limits storm organization and longevity. As a result, single-cell thunderstorms are generally short-lived, lasting 30 to 60 minutes on average. The life cycle of a single-cell storm is governed by the interaction between its updraft and downdraft, as in the absence of significant shear, the downdraft eventually falls into the path of the updraft, disrupting the inflow of warm, moist air. This self-limiting process causes the storm to weaken and dissipate shortly after reaching maturity. Due to their brief duration and lack of structural organization, single-cell thunderstorms rarely produce severe weather, though they may generate heavy rainfall, brief gusty winds, or small hail in isolated cases.
Multicell thunderstorms:
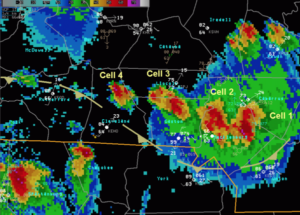 Multicell thunderstorms consist of a group of individual storm cells, each at different stages of development, clustered together in a semi-organized system. While each cell has its own life cycle, the overall cluster can persist for several hours due to continuous regeneration of new cells. These storms form in environments with moderate surface winds and increased wind shear, particularly in the lower to mid-levels of the atmosphere. This shear helps limit the spread of the gust front (produced by downdraft outflow), keeping it close enough to the updraft region to initiate new convective cells along the boundary. As one cell matures and dissipates, another may form just behind it, often leading to a “conveyor belt” effect of ongoing storm development. Multicell thunderstorms are the most common type of severe thunderstorm and are capable of producing a variety of hazards, including damaging winds, hail, localized flash flooding, and occasionally brief tornadoes, especially in well-organized clusters or when embedded within larger storm complexes.
Mesoscale Convective Systems:
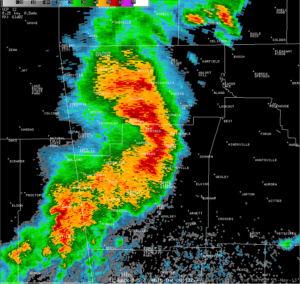 A Mesoscale Convective System (MCS) is a large, organized complex of thunderstorms that acts as a single cohesive system and can span hundreds of miles. MCSs typically form in environments with moderate to strong wind shear, especially in the mid and upper levels, which helps organize the convection and maintain storm structure over time. Moderate to high atmospheric instability is also necessary to support the deep, sustained updrafts that fuel the system. MCSs frequently develop along or ahead of frontal boundaries, low-level jets, or pre-existing outflow boundaries, where ample lift and moisture are present. One common form of an MCS is the squall line, which is a long, narrow band of thunderstorms that often produces a continuous line of strong winds. The hazards associated with MCSs can be significant. These systems are known for producing widespread damaging straight-line winds, particularly in the form of bow echoes, as well as large hail, torrential rainfall leading to flash flooding, and occasional tornadoes, especially near embedded circulations. Due to their size and longevity, MCSs can impact broad geographic areas and are a major contributor to warm-season severe weather across much of the central and eastern United States.
Supercells:
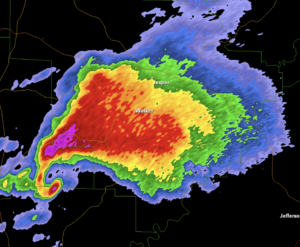 Supercell thunderstorms are the least common but most dangerous type of thunderstorm, distinguished by a persistently rotating updraft known as a mesocyclone. This rotation is sustained by a highly organized internal structure and is supported by strong directional and speed shear, particularly in the lower levels of the atmosphere. Supercells typically form in environments with moderate to extreme instability and strong vertical wind shear, which together allow the storm to separate its updraft and downdraft, preventing the downdraft from cutting off the storm’s fuel supply. Unlike other thunderstorm types, supercells are often isolated and can persist for several hours while maintaining intensity. Their rotating updrafts promote strong, sustained vertical motion, which allows for the development of very large hail, damaging straight-line winds, and long-lived tornadoes, including violent EF4 and EF5 events. Additionally, supercells are capable of producing localized flash flooding, particularly in slow-moving storms or those that repeatedly affect the same area (a process known as training). Due to their ability to organize and sustain themselves over time, supercells are responsible for a disproportionate number of high-impact severe weather events and remain a primary focus of severe weather forecasting and research.
Forecasting Severe Weather
Forecasting severe weather requires a careful analysis of both upper-level dynamics and surface-based conditions to identify environments capable of supporting thunderstorm development and organization. Meteorologists look for a combination of thermodynamic instability, lifting mechanisms, moisture availability, and wind shear to assess the potential for severe storms. One of the most important parameters is Convective Available Potential Energy (CAPE). CAPE quantifies the amount of buoyant energy available to rising air parcels and is a key indicator of atmospheric instability. Higher CAPE values generally over 1000 J/kg suggest a greater likelihood for vigorous updrafts, with values exceeding 2000–3000 J/kg often associated with intense thunderstorm development, particularly if other ingredients are in place. Greater CAPE can be reached with strong surface heating and moisture advection. Additionally, surface dewpoints near the surface temperature allow for a low lifted condensation level (LCL) where the cloud base will develop, and a low level of free convection (LFC) where parcels can rise freely without lift.
Moderate to strong deep-layer shear, typically in the 0–6 km layer, is necessary to organize storms and sustain updrafts, particularly for the formation of supercells and multicell clusters. A combination of speed shear (increasing wind speeds with height) and directional shear (turning of the winds with height) helps tilt the updraft away from the downdraft, enhancing storm longevity and increasing the potential for severe weather hazards such as large hail or tornadoes.
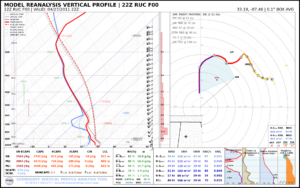
An example of a Skew-T (left) and hodograph (right) diagram with ample CAPE (left) and strong 0-3 km shear (right). Credit to SounderPy.
Surface features such as warm and cold fronts, drylines, and outflow boundaries often act as lifting mechanisms, triggering convection in otherwise stable environments. These boundaries also focus moisture convergence, another essential ingredient for storm development. In particular, forecasters monitor 850 mb moisture advection, especially from sources like the Gulf of Mexico, as it can significantly enhance CAPE and storm dynamics.
While surface conditions are integral, upper-level support plays a key role in storm enhancement and maintenance. Jet streaks—localized regions of faster winds within the jet stream—can enhance upper-level divergence, promoting rising motion below. Severe weather is especially favored in the left exit and right entrance regions of jet streaks, where divergence aloft helps evacuate air from the column, encouraging deeper ascent. Additionally, positively tilted or neutrally tilted troughs can help introduce dynamic lift and destabilization across a broad region, particularly when aligned with surface boundaries. Even at the surface, the nocturnal low-level jet can enhance moisture advection well into the night, allowing storms to persist even after peak heating has ended.
When all of these elements align—strong instability (high CAPE), sufficient moisture, lifting mechanisms, and organized shear—conditions are primed for severe thunderstorms. Skilled forecasters synthesize this information from model outputs, satellite imagery, radar data, and surface observations to issue timely and accurate severe weather forecasts and warnings.
Severe Weather Safety
Watches and warnings issued by the National Weather Service are crucial to understanding the risk posed by severe weather and how you can plan accordingly.
- Severe thunderstorm watch: This is issued by the National Weather Service when conditions are favorable for the development of severe thunderstorms in and close to the watch area. They are usually issued for a duration of 4 to 8 hours and are issued well in advance of the actual occurrence of severe weather.
- Severe thunderstorm warning: This is issued when either a severe thunderstorm is indicated by the WSR-88D radar or a spotter reports a thunderstorm meeting severe criteria (i.e. >58 mph winds, >1” hail, and/or a tornado); therefore, people in the affected area should seek safe shelter immediately.
- Tornado watch: Similar to a severe thunderstorm watch, this is issued by the National Weather Service when conditions are favorable for the development of tornadoes in and close to the watch area. They are once again usually issued several hours before the severe weather event, and last between 4-8 hours.
- Tornado warning: This is issued when a tornado is indicated by the WSR-88D radar or sighted by spotters and can be issued without a Tornado Watch being already in effect. They often last about 30 minutes, and people in the affected area should seek shelter immediately.
- Flash Flood Watch: These are issued to indicate current or developing hydrologic conditions that are favorable for flash flooding in and close to the watch area, but the occurrence is neither certain or imminent.
- Flash Flood Warning: These are issued to inform the public, emergency management, and other cooperating agencies that flash flooding is in progress, imminent, or highly likely.
The Storm Prediction Center is a division of the National Weather Service, and they will issue categorical outlooks that classify areas into five primary risk levels days ahead of possible severe weather:
- Marginal (Green) – Isolated severe storms possible; limited in coverage and intensity.
- Slight (Yellow) – Scattered severe storms possible; short-lived or marginally intense.
- Enhanced (Orange) – Numerous severe storms likely; more persistent and intense.
- Moderate (Red) – Widespread severe storms expected; some significant threats likely.
- High (Pink) – A severe weather outbreak is expected; long-lived and destructive storms, including strong tornadoes, widespread damaging winds, or very large hail.
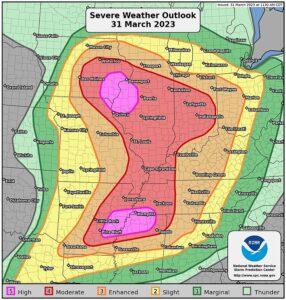
An example of the SPC’s categorical severe weather outlook. Credit to the Storm Prediction Center
Scalia Laboratory will also follow these color guidelines when issuing forecasts.
These risk levels are determined by assessing probabilistic thresholds for each hazard—tornadoes, damaging winds, and large hail—alongside key atmospheric ingredients such as CAPE, vertical wind shear, low-level helicity, moisture availability, and the presence of surface and upper-level forcing mechanisms.
Severe thunderstorms can develop quickly and pose a variety of hazards, including damaging winds, large hail, flash flooding, and tornadoes. Being prepared and knowing how to respond can significantly reduce the risk of injury or loss of life during these events.
Before a possible severe storm, stay informed by monitoring local forecasts and signing up for weather alerts via NOAA Weather Radio, mobile apps, or local news outlets. Have a plan in place for where to seek shelter, especially if you live in a mobile home or travel frequently. Secure outdoor items like patio furniture, umbrellas, or trash bins, which can become dangerous projectiles in high winds. Prepare an emergency kit with flashlights, batteries, a first aid kit, bottled water, and essential medications.
During the storm, seek shelter indoors, preferably in a sturdy building. Stay away from windows and glass doors. If you are outside and can’t reach shelter, avoid open areas, isolated trees, and high ground. Do not use electrical appliances or plumbing, as lightning can travel through wiring and pipes. If driving, pull over safely and remain in the vehicle. Avoid stopping under trees or power lines. Never attempt to drive through flooded roadways—turn around, don’t drown.
After a severe storm has passed, be cautious of downed power lines, debris, and flooded areas. Report hazards such as fallen trees or electrical lines to local authorities and continue monitoring weather updates in case additional storms are expected.
Even “ordinary” thunderstorms can become dangerous in the right conditions. Taking warnings seriously and acting quickly can make all the difference during severe weather events.
Winter Weather
What is Winter Weather?
Winter weather can follow along mid-latitude cyclone systems, but the conditions are vastly different. Winter weather can encompass multiple types of liquid and frozen precipitation, namely snow, sleet, freezing rain, and rain. For it to snow, the lower levels of the atmosphere must have a wet bulb (NOT air temperature) below 32 degrees Fahrenheit for the snowflakes to remain as hexagonal ice crystals. Sleet occurs when an area of warmer air melts the snowflake into a raindrop, but the raindrop refreezes completely within sub-freezing air above the surface. These appear as ice pellets when they hit the ground. Freezing rain occurs when the wet bulb temperature above the surface is warmer than 32 degrees Fahrenheit, but a vertically shallow layer of air near the surface is below freezing. This precipitation will fall as rain, but then freeze on or soon after contact with the ground. Should the wet bulb temperature profile remain above freezing consistently, what originates as snow will melt and stay as rain to the surface.
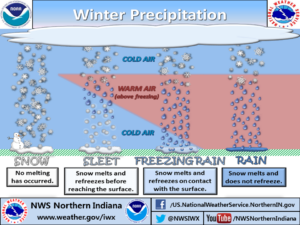
A cross-sectional example of how warm air can transform snow into different precipitation types. Credit to NWS Indiana
Forecasting Winter Weather
Winter weather remains one of the most challenging aspects of forecasting, largely due to the narrow temperature thresholds that determine the four main types of precipitation. Understanding where winter weather is likely to occur begins with recognizing its association with common weather features. In the Midwest, the midlatitude cyclone is often the primary driver of winter weather. Its interactions with high-pressure systems play a critical role in determining the geographical extent of winter conditions. These interactions are shaped by the balance of warm and cold air advection, as well as the availability of atmospheric moisture. Refer to the left figure for an illustration of typical weather patterns that contribute to winter weather.
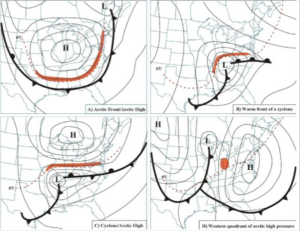
A four-panel figure of different pressure systems and their fronts (black and bold), and the relative location of where winter weather may occur (orange).
When using forecasting models, distinguishing between types of winter precipitation often begins with analyzing the 5400-gpm line (commonly referred to as “540”) on a 1000-500 mb thickness map. Geopotential thickness is directly proportional to the average virtual temperature between two atmospheric levels: warmer air results in a thicker column, while colder air produces a shallower column. Consequently, regions with heights greater than 5400 gpm typically experience rain, whereas heights below 5400 gpm are more likely to produce snow. Identifying this boundary on a map helps forecasters determine where precipitation is likely to transition from rain to snow within a region.
In addition, analyzing temperature advection at the 800 mb and 925 mb levels is critical for differentiating precipitation types. For example, warm air advection ahead of a warm front can lead to freezing rain, as rising warm air overlays a surface layer of subfreezing temperatures. Conversely, cold air advection can result in rain transitioning to snow, sleet, or freezing rain, depending on the depth and intensity of the cold air. Therefore, one of the most valuable tools for identifying differential advection across atmospheric levels is the Skew-T log-P diagram, which provides a detailed vertical profile of the atmosphere.
Forecasting snowfall amounts often utilizes snowfall ratios. Traditionally, the “10:1 ratio” (10 inches of snow equals 1 inch of liquid water) has been a standard reference. However, this ratio can vary significantly depending on atmospheric conditions. For example, when the temperature throughout the layer from the surface to the cloud hovers near freezing, snowfall ratios tend to decrease, whereas a deep, cold atmospheric layer can lead to much higher snowfall ratios
Winter Weather Safety
Understanding the National Weather Service’s criteria for winter weather alerts is essential for assessing the potential threat posed by a winter weather event. For the Charleston, WV Forecasting Office, Watches are issued when forecaster confidence in meeting criteria reaches 50%, typically 12 to 72 hours before the onset of wintry conditions. Warnings and Advisories are issued when forecaster confidence reaches 80%, usually within 24 hours of the event’s onset. These criteria may be adjusted based on the anticipated impacts of the event. Below are some of the alerts that may be issued, along with their specific criteria.
Blizzard Warning
- Sustained wind or frequent gusts of 35 mph or higher, AND visibility less than 1/4 mile in snow and/or blowing snow for 3 hours or longer.
Ice Storm Warning
- Damaging ice accumulations of 1/4″ or more.
Winter Storm Watch/Warning
- Snowfall of 4-6″ or more, event-driven up to a 48-hour period, OR sleet accumulation of 1/2″ or more in 24 hours.
Winter Weather Advisory
- Snow, blowing snow, ice, sleet, or a combination of these wintry elements is expected to cause winter driving conditions and difficult travel.
Cold Weather Advisory
- Temperatures and/or wind chills at -5 degrees or lower.
Extreme Cold Watch/Warning
- Temperatures and/or wind chills at -15 degrees or lower
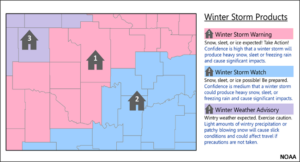
Infographic by the National Weather Service defining the hazards contributing to the issuance of different winter weather alerts.
In addition, local Emergency Management agencies may issue Snow Emergencies to warn the public about the hazards of driving under current conditions. These emergencies are categorized into the following levels:
Level 1: Roadways are hazardous with blowing and drifting snow. Roads may also be icy. Motorists are urged to drive very cautiously.
Level 2: Roadways are hazardous with blowing and drifting snow. Roads may also be very icy. Only those who feel it is necessary to drive should be out on the road.
Level 3: All roadways are closed to non-emergency personnel. No one should drive unless absolutely necessary.
Before a winter storm arrives, ensure you are stocked with essential survival items, including a first aid kit, water, non-perishable food, heavy clothing, and blankets for insulation. Additionally, have batteries, chargers, and flashlights readily available. For your vehicle, keep a full tank of gas and equip it with jumper cables, shovels, brushes, a spare tire, and an emergency kit. If you have pets or livestock, move them to sheltered areas or indoors, and ensure they have sufficient water and fresh food.
If you are caught outside during a winter storm, seek the nearest shelter and cover any exposed skin to avoid frostbite. If driving, reduce your speed significantly and ensure you have charged devices and an emergency kit. Avoid travel unless absolutely necessary. If you are indoors, remain there. If the heat goes out, close off unnecessary rooms to conserve warmth and insulate your living area as much as possible. After a winter storm, continue to stay off the roads until conditions improve, as hazards such as flooding from snowmelt or downed power lines may persist.
Below are several helpful resources to deepen your understanding of winter weather preparedness and safety strategies.
https://www.weather.gov/safety/winter
https://www.weather.gov/rlx/criteria
https://www.weather.gov/arx/wintersafety
https://weathersafety.ohio.gov/weather-safety/winter-weather
https://ready.ohio.gov/are-you-ready/winter-storms
How Scalia Lab Forecasts
Our forecasts listed on our icon cards span from 0-48 hours. Typically, this information will be more specific and more accurate than our long range forecasts, which encompass 48-108 hours. Our forecast discussions will be geared for the general public, though those wanting a more in-depth and lengthy forecast can read our technical discussions. Our color cards will often convey levels of cloud cover, as well as severe risks. The icons are a snapshot of the weather to come, much like you would see on your weather app. We aim to publish forecasts at approximately 8 AM and 8 PM, as well as provide live-updates to severe or winter weather through our social media outlets. Our area of coverage extends from Ohio University to our neighbors around Southeastern Ohio.