Antarctic Seasonal Pressure Reconstructions 1905-2013
To access the spatial pressure reconstructions, please click here.
Overview:
This project created seasonal reconstructions for many of the long-term Antarctic station records, in order to understand better the relative roles of natural variability and change during the 20th Century. Using midlatitude pressure records that were significantly correlated to the individual station being reconstructed, a principal component regression reconstruction technique was employed. The records were extended back to 1905 for all locations, and several different approaches were attempted:
- Reconstructions based on groups of midlatitude predictor stations that were correlated at p<0.05 and p<0.10, termed the 5% and 10% networks, respectively;
- Reconstructions based on detrended and original predictor and predict and seasonal pressure data;
- Reconstructions with predictor and predict and data ending in 2011 vs. 2013;
- Reconstructions calibrated over 1957-2011 (or 2013, whichever the ending year is), and validated using a leave-one-out cross validation procedure, termed the ‘full period’ reconstructions;
- Reconstructions calibrated during the first 30 years (1957-1986) and validated over the last 25-27 years (1987-2011 or 1987-2013), termed the ‘early’ reconstructions;
- Reconstructions calibrated during last 30-32 years (1982-2011 or 1982-2013) and validated over the first 25 years (1957-1981), termed the ‘late’ period reconstructions;
- Reconstructions using all of the above mentioned methods with now incorporating in reanalysis data from HadSLP2 and NOAA 20CR, termed the ‘pseudo’ reconstructions.
NOTE: Any reconstructions termed ‘original’ reconstructions are any reconstructions not using ‘pseudo’ data. Reconstructions using ‘pseudo’ data from reanalysis products are termed ‘pseudo’ reconstructions.
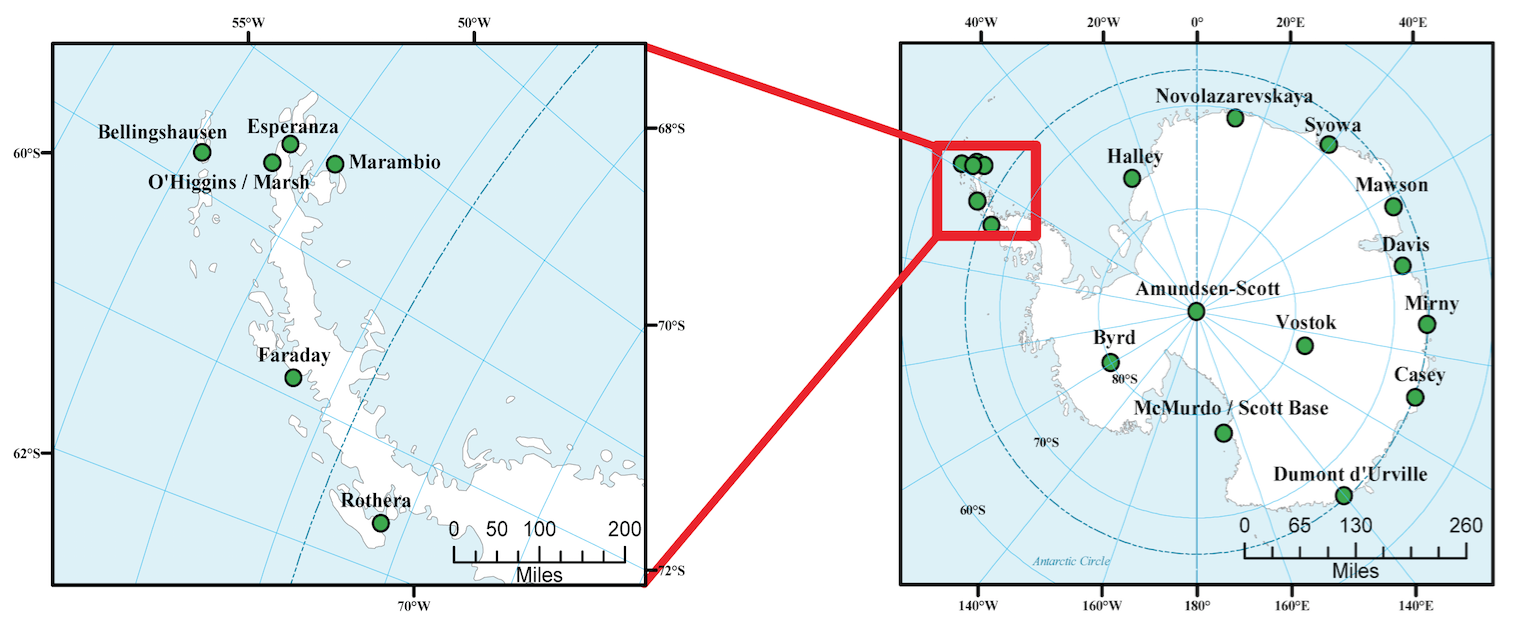
We provide here all the reconstruction data for each station (which can be accessed using the map below), including the best overall reconstructions for all stations on this homepage.
Acknowledgments:
This work is supported by funding from the National Science Foundation, through the Antarctic Oceanic and Atmospheric Sciences award PLR-1341621.
Relevant Publications:
For further information on the reconstruction methodology, please see the seasonal SAM index reconstructions, or the following publications:
- Jones, J. M., R. L. Fogt, M. Widmann, G. J. Marshall, P. D. Jones, and M. Visbeck, 2009: Historical SAM Variability. Part I: Century length seasonal reconstructions. J. Climate, 22, 5319-5345, doi: 10.1175/2009JCLI2785.1
- Fogt, R. L., J. Perlwitz, A. J. Monaghan, D. H. Bromwich, J. M. Jones, and G. J. Marshall, 2009: Historical SAM Variability. Part II: 20th century variability and trends from reconstructions, observations, and the IPCC AR4 Models. J. Climate, 22, 5346-5365, doi: 10.1175/2009JCLI2786.1
For details on the Antarctic station-based pressure reconstructions, please see the following publications:
- Fogt, R. L., C. A. Goergens, M. E. Jones, G. A. Witte, M. Y. Lee, and J. M. Jones, 2016: Antarctic station-based pressure reconstructions since 1905: 1. Reconstruction evaluation. J. Geophysical Res.-Atmospheres, 21, 2814-2835, doi:10.1002/2015JD024564. Access here from Wiley online library
- Fogt, R. L., J. M. Jones, C. A. Goergens, M. E. Jones, G. A. Witte, and M. Y. Lee, 2016: Antarctic station-based pressure reconstructions since 1905: 2. Variability and trends during the twentieth century. J. Geophysical Res.-Atmospheres, 21, 2836-2856, doi:10.1002/2015JD024565. Access here from Wiley online library
Contacts:
For additional information, please feel free to email Dr. Ryan L. Fogt (fogtr@ohio.edu)
Reconstruction Performance
The evaluation statistics for the best performing original reconstructions for all the ‘full period’ reconstructions are summarized in the tables below. Full details on the length of the records (both for midlatitude and Antarctic stations reconstructed) and other skill measures can be found in Fogt et al. 2016.
December-January-February (DJF)
| Stations | Calibration Correlation | Validation Correlation | Reduction of Error | Coefficient of Efficiency |
|---|---|---|---|---|
| Amundsen-Scott Bellingshausen Byrd Casey Davis Dumont Esperanza Faraday Halley Marambio Marsh / O’Higgins Mawson McMurdo / Scott Base Mirny Novolazarevskaya Rothera Syowa Vostok |
0.859 0.830 0.826 0.794 0.754 0.816 0.909 0.899 0.923 0.760 0.819 0.885 0.872 0.842 0.873 0.886 0.773 0.832 |
0.790 0.733 0.732 0.746 0.660 0.779 0.813 0.820 0.890 0.637 0.725 0.813 0.824 0.737 0.843 0.805 0.710 0.774 |
0.737 0.761 0.745 0.749 0.765 0.750 0.826 0.808 0.852 0.742 0.743 0.783 0.760 0.709 0.780 0.798 0.671 0.792 |
0.615 0.652 0.617 0.675 0.647 0.685 0.652 0.665 0.789 0.659 0.635 0.655 0.674 0.528 0.729 0.652 0.598 0.702 |
March-April-May (MAM)
| Stations | Calibration Correlation | Validation Correlation | Reduction of Error | Coefficient of Efficiency |
|---|---|---|---|---|
| Amundsen-Scott Bellingshausen Byrd Casey Davis Dumont Esperanza Faraday Halley Marambio Marsh / O’Higgins Mawson McMurdo / Scott Base Mirny Novolazarevskaya Rothera Syowa Vostok |
0.721 0.853 0.668 0.559 0.738 0.660 0.785 0.819 0.608 0.725 0.719 0.742 0.678 0.717 0.779 0.699 0.719 0.660 |
0.678 0.818 0.603 0.486 0.660 0.606 0.748 0.778 0.529 0.670 0.770 0.671 0.635 0.677 0.732 0.635 0.638 0.609 |
0.520 0.739 0.473 0.313 0.554 0.441 0.615 0.672 0.369 0.637 0.565 0.551 0.459 0.514 0.627 0.503 0.545 0.464 |
0.456 0.682 0.385 0.222 0.438 0.353 0.557 0.601 0.269 0.586 0.559 0.438 0.401 0.456 0.570 0.411 0.430 0.409 |
June-July-August (JJA)
| Stations | Calibration Correlation | Validation Correlation | Reduction of Error | Coefficient of Efficiency |
|---|---|---|---|---|
| Amundsen-Scott Bellingshausen Byrd Casey Davis Dumont Esperanza Faraday Halley Marambio Marsh / O’Higgins Mawson McMurdo / Scott Base Mirny Novolazarevskaya Rothera Syowa Vostok |
0.685 0.914 0.563 0.765 0.683 0.731 0.853 0.871 0.721 0.814 0.884 0.667 0.793 0.787 0.818 0.810 0.574 0.723 |
0.578 0.884 0.391 0.712 0.595 0.650 0.823 0.841 0.612 0.760 0.838 0.555 0.632 0.648 0.689 0.765 0.423 0.659 |
0.469 0.836 0.376 0.586 0.492 0.534 0.733 0.758 0.519 0.776 0.809 0.444 0.630 0.619 0.675 0.644 0.376 0.535 |
0.316 0.779 0.213 0.503 0.372 0.412 0.680 0.706 0.365 0.737 0.746 0.290 0.375 0.398 0.472 0.571 0.220 0.446 |
September-October-November (SON)
| Stations | Calibration Correlation | Validation Correlation | Reduction of Error | Coefficient of Efficiency |
|---|---|---|---|---|
| Amundsen-Scott Bellingshausen Byrd Casey Davis Dumont Esperanza Faraday Halley Marambio Marsh / O’Higgins Mawson McMurdo / Scott Base Mirny Novolazarevskaya Rothera Syowa Vostok |
0.619 0.853 0.765 0.698 0.623 0.641 0.762 0.769 0.676 0.697 0.711 0.616 0.731 0.635 0.581 0.623 0.594 0.615 |
0.395 0.819 0.621 0.529 0.545 0.540 0.712 0.747 0.536 0.633 0.647 0.557 0.612 0.534 0.505 0.522 0.546 0.514 |
0.383 0.745 0.637 0.461 0.405 0.411 0.581 0.591 0.457 0.579 0.601 0.370 0.534 0.445 0.332 0.434 0.363 0.385 |
0.085 0.689 0.448 0.224 0.295 0.277 0.502 0.557 0.262 0.514 0.530 0.291 0.357 0.285 0.250 0.362 0.304 0.259 |
Data
Please click here for access to all of the best performing reconstructions in an MS Excel spreadsheet.
Please click on each individual station to access more data pertaining to each station individually, or (especially if on a mobile device) click here for a page containing the full listing: