
Antarctic Seasonal Spatial Pressure Reconstructions 1905-2013
Overview:
This project created seasonal spatial pressure reconstructions from 60ºS – 90ºS using 19 long-term station reconstructions / observations as anchor points; observations were used at Orcadas since the meteorological record extends back to 1903. The spatial pressure reconstruction was completed to better understand the relative roles of natural variability and change during the 20th Century in a spatially complete (horizontally and temporally) manner, especially away from the reconstructed stations. Using 19 reconstructed / observed pressure records across the Antarctic continent, a kriging interpolation technique was employed. The spatial reconstruction extends back to 1905, based on the two approaches to the station-based reconstructions from Fogt et al. (2016a,b), called the ‘original’ and ‘pseudo’ station reconstructions.
More information on the original and pseudo station-based pressure reconstructions can be found by clicking here.
Here, all the seasonal spatial reconstruction data can be accessed using the links below. The skill statistics in multiple figures can also be downloaded below.
Acknowledgments:
This work is supported by funding from the National Science Foundation, through the Antarctic Oceanic and Atmospheric Sciences award PLR-1341621.
Relevant Publications:
For further information on the reconstruction methodology, please see the following publications:
- Nicolas, J. P., and D. H. Bromwich, 2014: New reconstruction of Antarctic near-surface temperatures: Multidecadal trends and reliability of global reanalyses. J. Climate, 27, 8070–8093, doi:10.1175/JCLI-D-13-00733.1
- Monaghan, A. J., and Coauthors, 2006: Insignificant change in Antarctic snowfall since the International Geophysical Year. Science, 313, 827–831, doi:10.1126/science.1128243
- Monaghan, A. J., D. H. Bromwich, W. Chapman, and J. C. Comiso, 2008: Recent variability and trends of Antarctic near surface temperature. J. Geophys. Res., 113, D04105, doi:10.1029/2007JD009094
For details on the Antarctic station-based pressure reconstructions and skill statistics used in this study, please see the following publications:
- Fogt, R. L., C. A. Goergens, M. E. Jones, G. A. Witte, M. Y. Lee, and J. M. Jones, 2016: Antarctic station-based pressure reconstructions since 1905: 1. Reconstruction evaluation. J. Geophysical Res.-Atmospheres, 21, 2814-2835, doi:10.1002/2015JD024564. Access here from Wiley online library
- Fogt, R. L., J. M. Jones, C. A. Goergens, M. E. Jones, G. A. Witte, and M. Y. Lee, 2016: Antarctic station-based pressure reconstructions since 1905: 2. Variability and trends during the twentieth century. J. Geophysical Res.-Atmospheres, 21, 2836-2856, doi:10.1002/2015JD024565. Access here from Wiley online library
Contacts:
For additional information, please feel free to email Dr. Ryan L. Fogt (fogtr@ohio.edu)
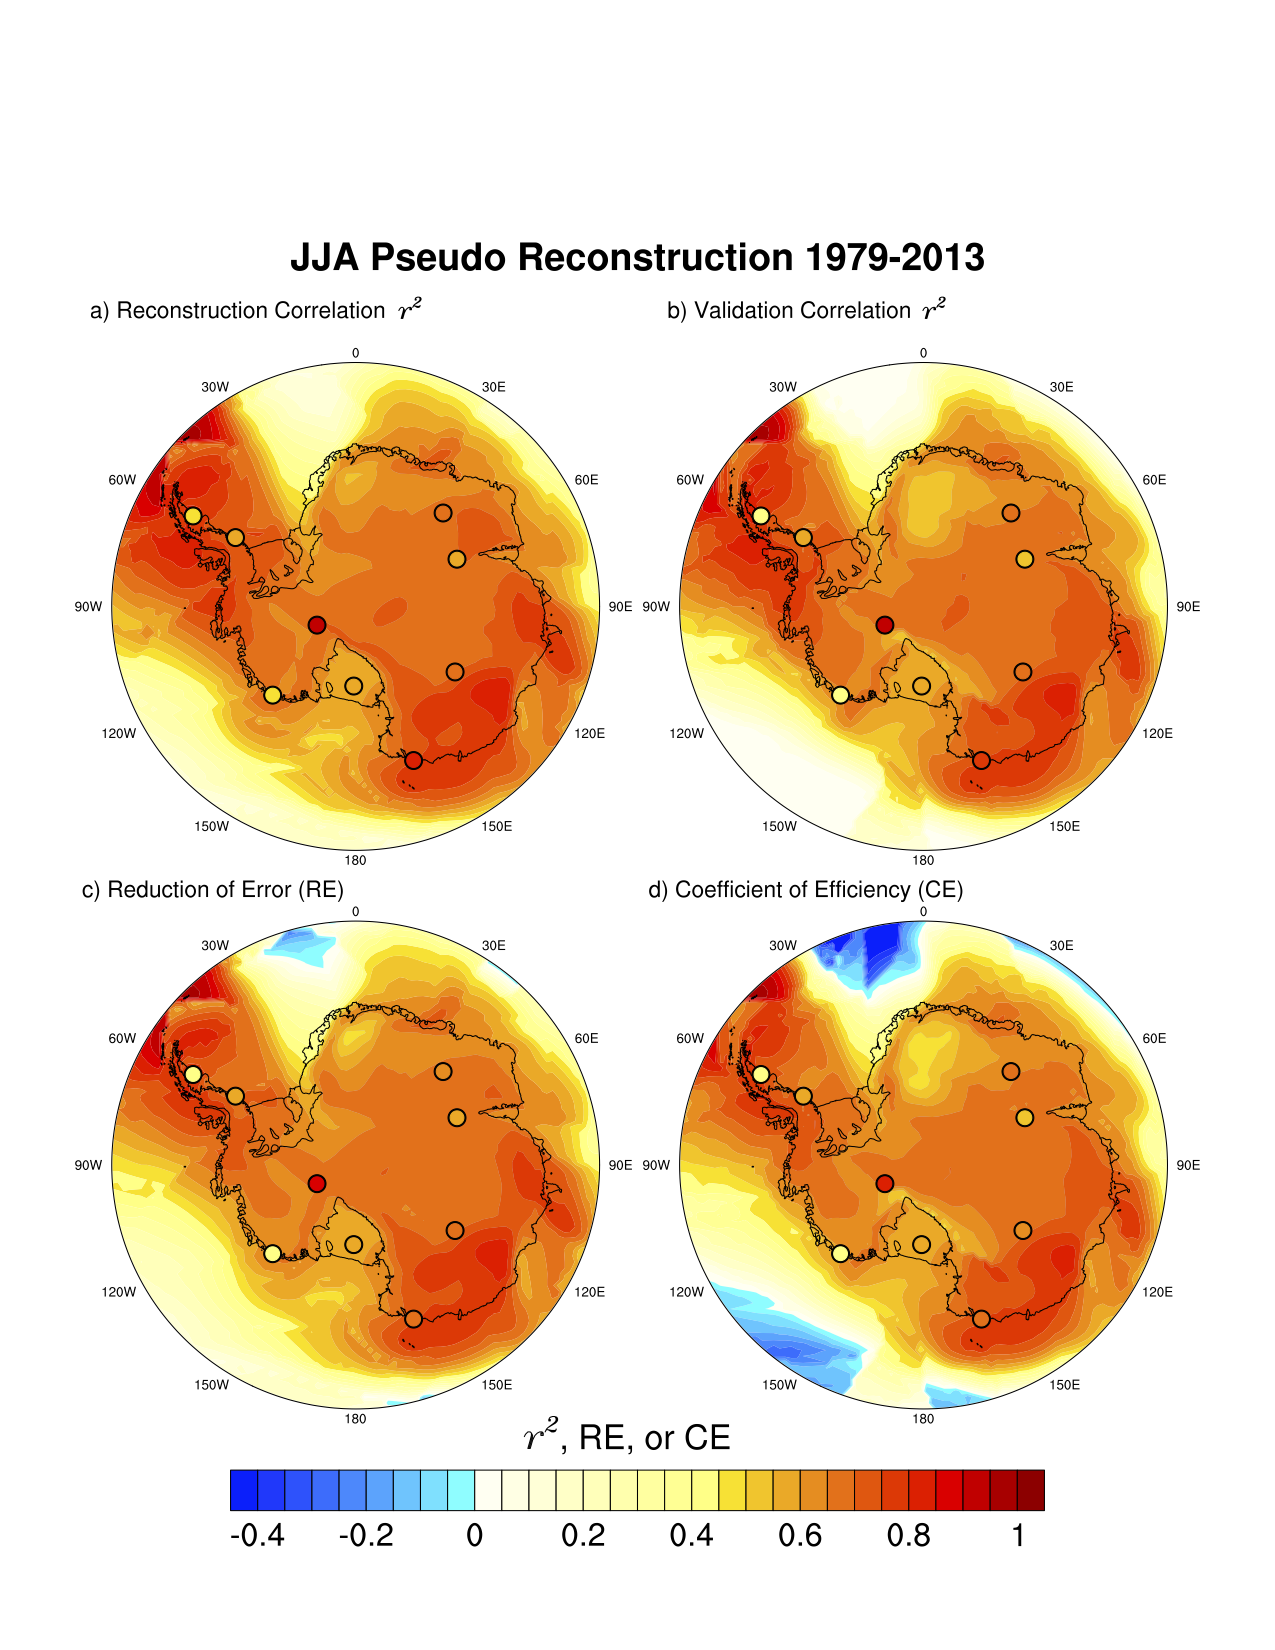
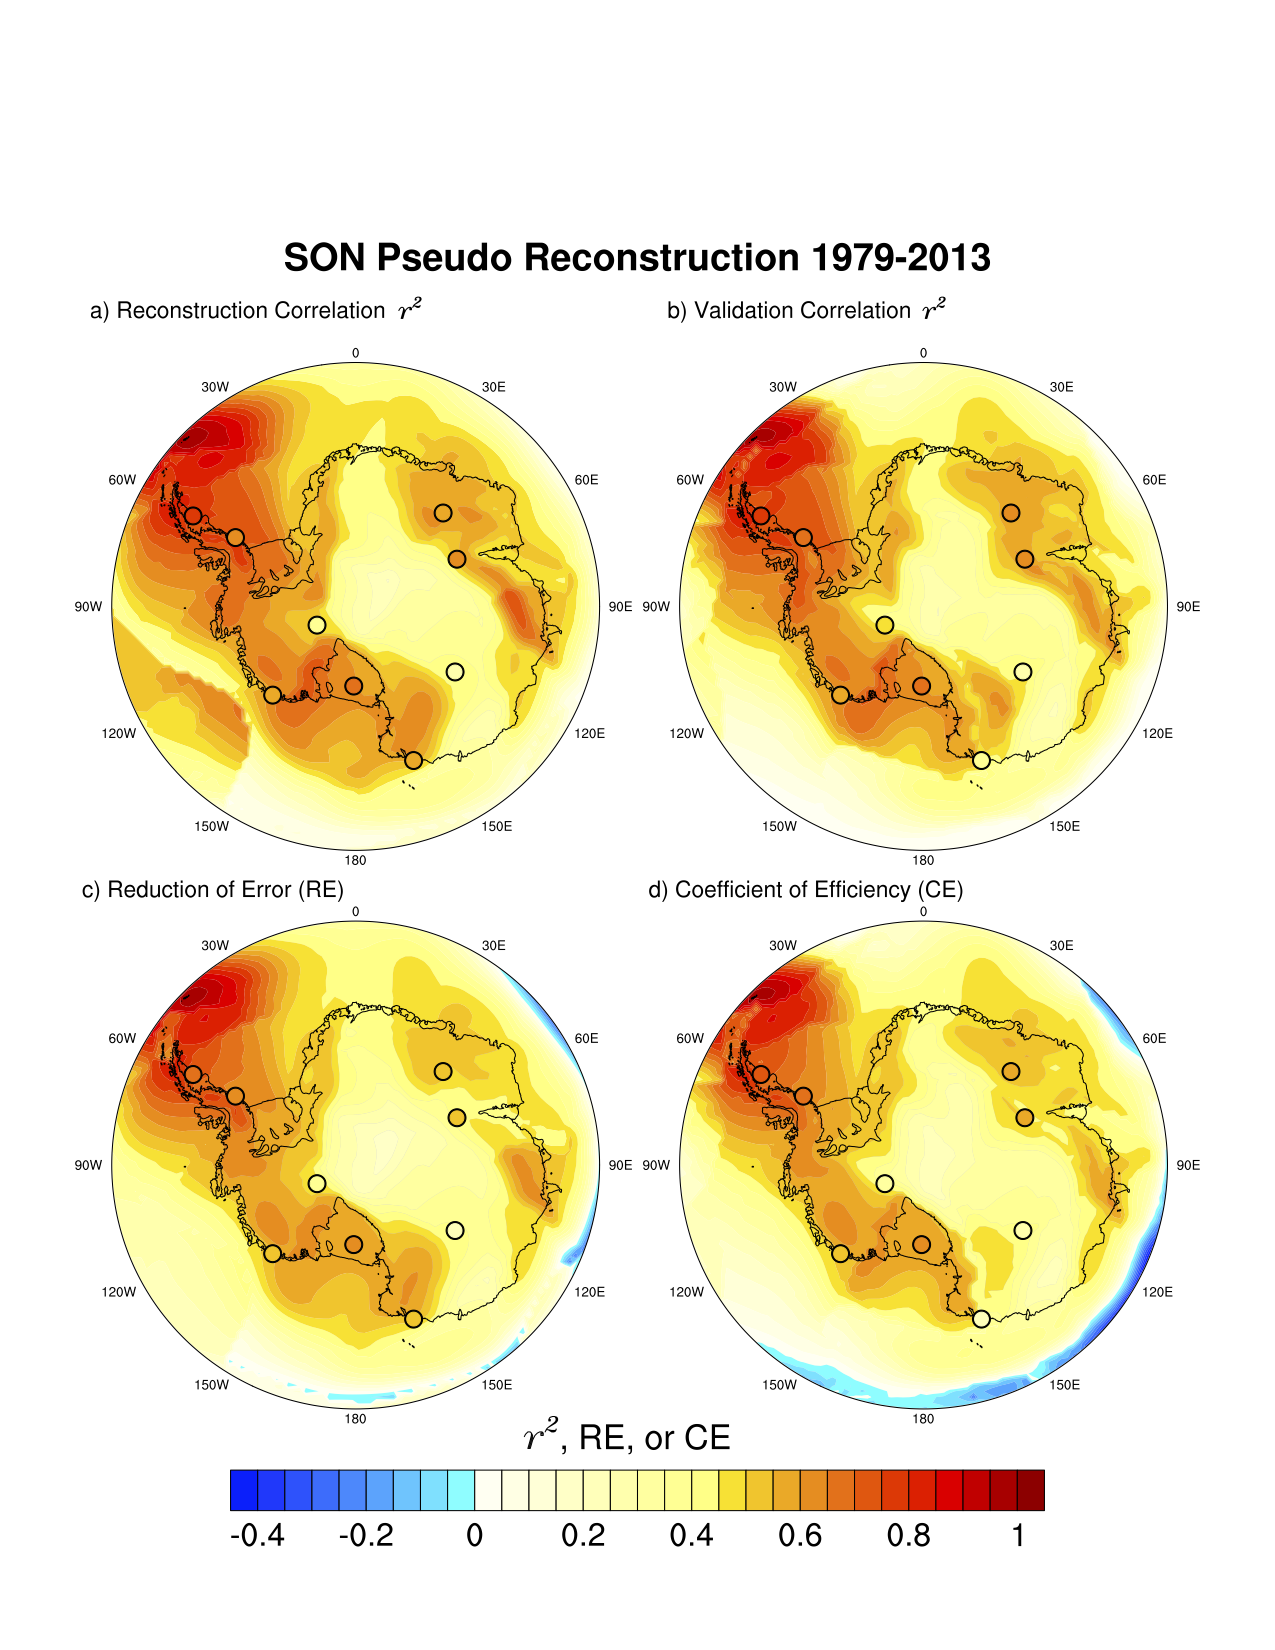
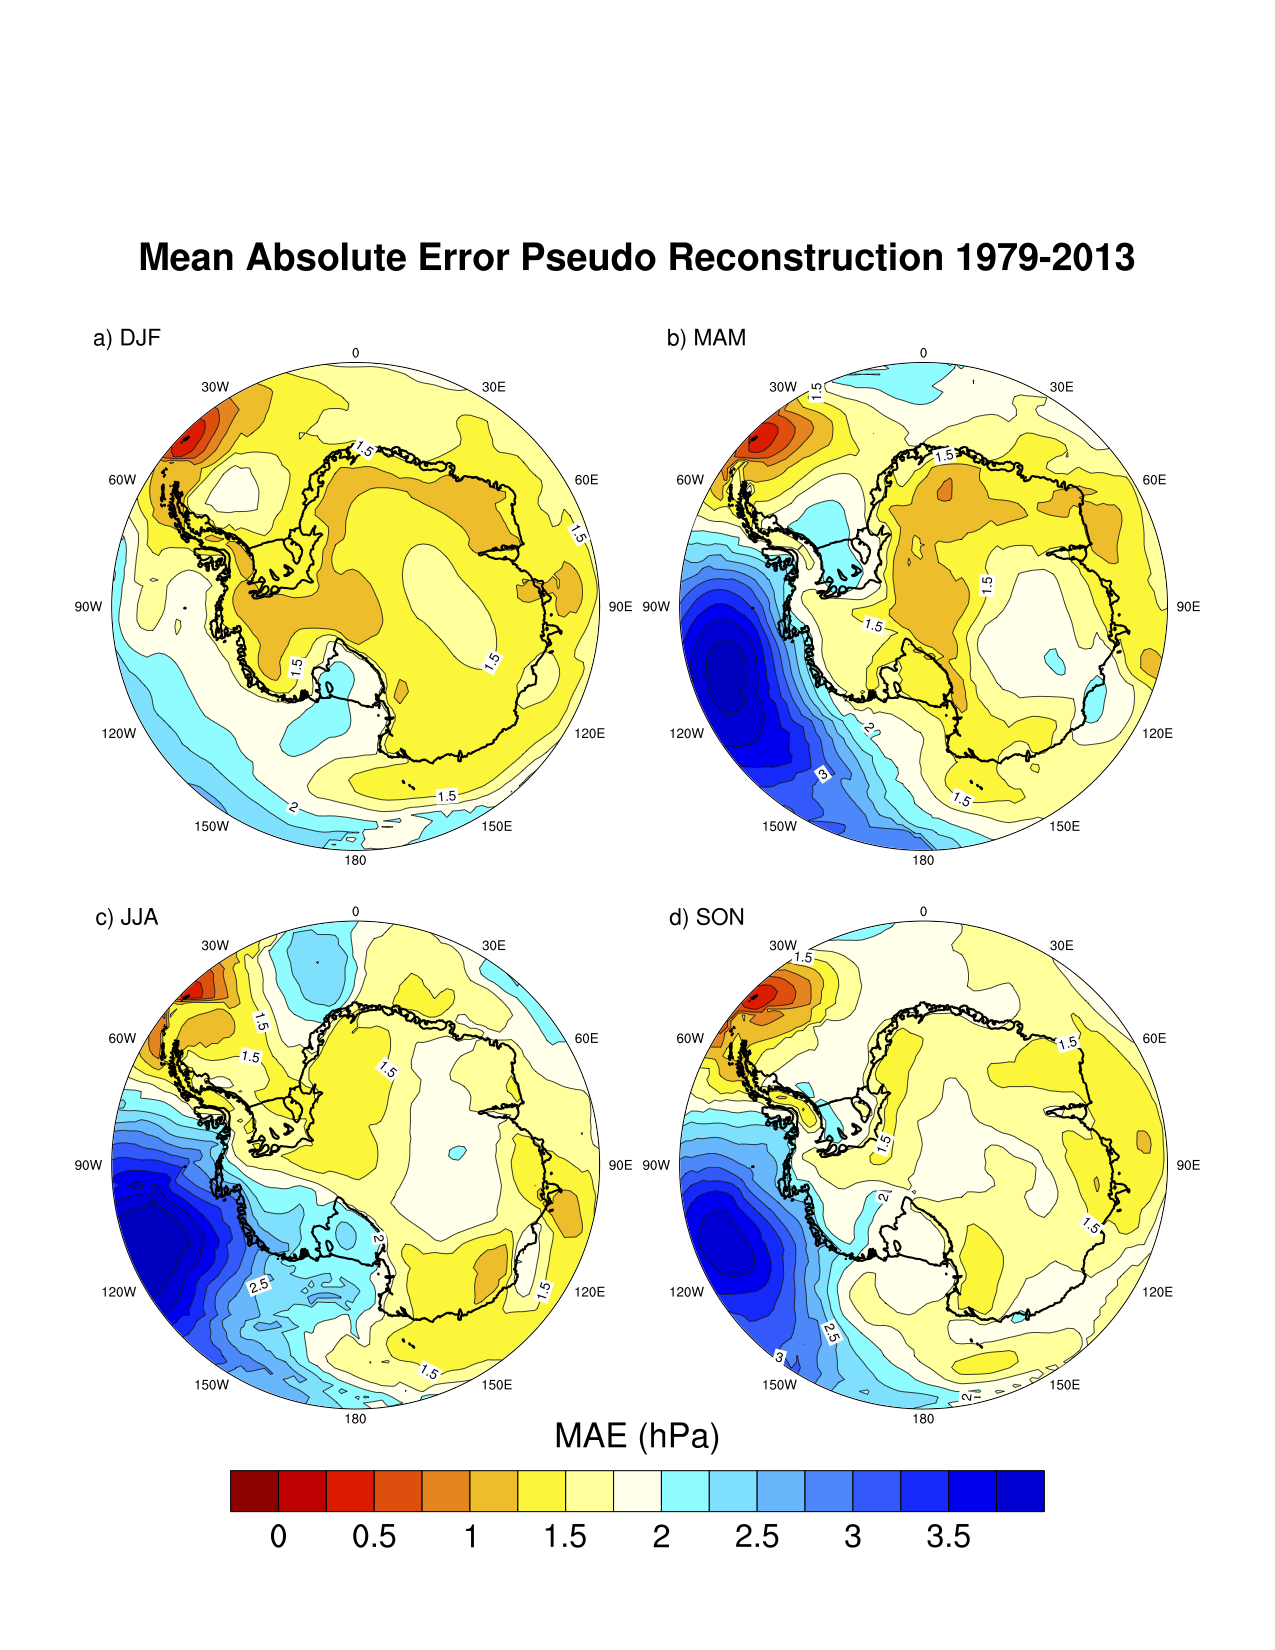
RECONSTRUCTION PERFORMANCE
The skill statistics are calculated during 1979-2013 in comparison to ERA-Interim reanalysis data, and include the following: r2 for both the reconstruction and validation timeseries, the Reduction of Error (RE), the Coefficient of Efficiency (CE), and the Mean Absolute Error (MAE). In each of the figures provided in the links below, the background fill corresponds to the skill statistics between the spatial reconstruction and ERA-Interim. The nine dots represent those nine Automatic Weather Stations (AWS) used in this study. The AWS fill color corresponds to the skill statistic between the AWS observation and the spatial reconstruction.
The skill statistics of the original seasonal spatial pressure reconstructions can be downloaded here or viewed at the bottom of this page.
The skill statistics of the pseudo seasonal spatial pressure reconstructions can be downloaded here or viewed at the bottom of this page.
DATA
Click here to access the seasonal spatial pressure reconstructions in NetCDF format.
The figure below indicates the stations used to generate the spatial reconstruction (green / red dots). The purple dots indicate those Automatic Weather Stations (AWS) used for spatial reconstruction evaluation.
Click on the image to enlarge it.
Original Reconstruction Skill Statistics
Click on the image to enlarge it.


Pseudo Reconstruction Skill Statistics
Click on the image to enlarge it.


Last Revised: April 2017